sara.viz
Actionnable insights inspired by Reinforcement Learning.
This module contains function to plot Q-tables.
- sara.viz.plot_insight(df: DataFrame[RTGSchema], col_labels: list, filename: str | Path | None = None, *, normalize_on_x: bool = False, argmax_on_x: bool = False, csv_prefix: str | None = None, csv_buffers: dict[str, BinaryIO] | None = None) tuple[BytesIO, BytesIO | None, BytesIO | None][source]
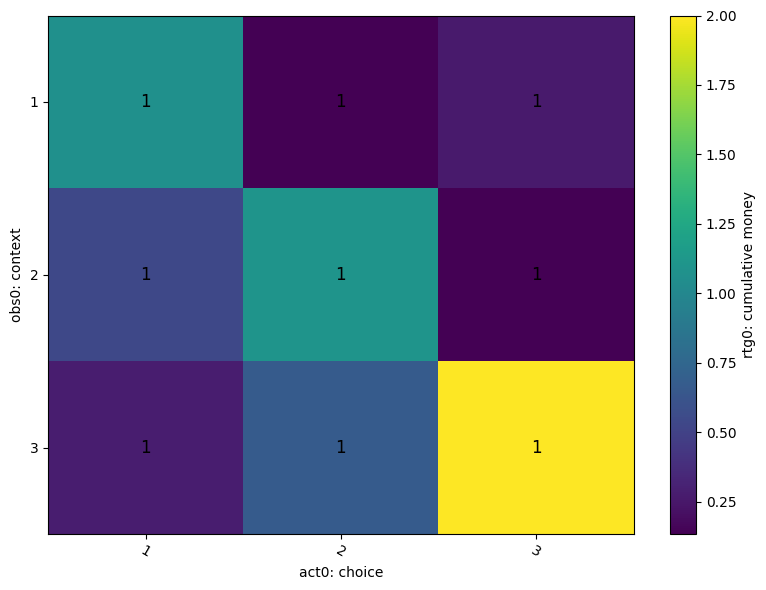
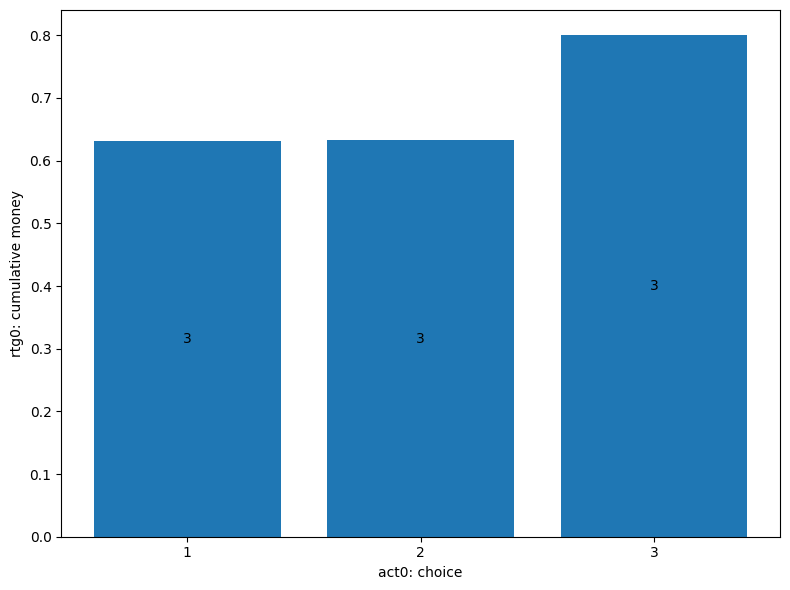
Plot heatmap or histogram from OAR dataframe with return-to-go.
Heatmap if there is 2 labels, histogram is for 1 label. Heatmap color or histogram height is the return-to-go averaged against grouping labels. The number of samples used in the average is displayed as a number in the tiles for the heatmap and in the bar for the histogram.
- Parameters:
df – the dataframe to plot, it should validates
RTGSchema,col_labels – the labels used to group the dataframe before averaging, - first label is xaxis - second label is yaxis, only for heatmap
filename – if provided, plot will be saved in this file else, plot will be displayed
normalize_on_x – whether to normalize return-to-go over x-axis
argmax_on_x – whether to highlight argmax over x-axis
csv_prefix – TODO Krzysztof
csv_buffers – TODO Krzysztof
- Returns:
TODO Krzysztof
Examples
Initialize OAR dataframe
>>> import pandas as pd
>>> from itertools import product
>>> from sara.oar import OARSchema, enrich_rtg
>>> oa0s = list(product([1, 2, 3], [1, 2, 3]))
>>> obs0s, act0s = zip(*oa0s, strict=True)
>>> rew1s = (float(o==a) for o, a in oa0s)
>>> df = pd.DataFrame({
...     ("obs0", "context"): obs0s,
...     ("act0", "choice"): act0s,
...     ("rew1", "money"): rew1s})
>>> df.columns.names = ("signal", "key")
>>> df = df.set_index(
...     pd.MultiIndex.from_product([[0], pd.date_range("2000-01-01", periods=len(obs0s))],
...     names=["episode", "date"]))
>>> df = OARSchema.validate(df)
>>> df = enrich_rtg(df, .5)
Plot histogram visualization
>>> from sara.viz import plot_insight
>>> from pathlib import Path
>>> filename_histogram = Path(
...     'docs/source/viz/histogram.png')  # to update plot in doc
>>> filename_heatmap = Path(
...     'docs/source/viz/heatmap.png')  # to update plot in doc
>>> _,_,_ = plot_insight(
...     df, col_labels=[("act0", "choice")],
...     filename=filename_histogram)  # histogram
>>> _,_,_=plot_insight(
...     df, col_labels=[("act0", "choice"), ("obs0", "context")],
...     filename=filename_heatmap)  # heatmap