Sintrom
Sintrom sara.viz example.
>>> import textwrap
>>> from examples.sintrom import SintromEnvSchema
>>> print(textwrap.fill(SintromEnvSchema.Config.metadata["description"], width=80))
Sintrom (acenocoumarol) is an oral anticoagulant of the vitamin K antagonist
class, prescribed to reduce the risk of thromboembolic events in conditions such
as atrial fibrillation, venous thrombosis, pulmonary embolism, or in patients
with prosthetic heart valves. Its action is monitored using the International
Normalized Ratio (INR), a standardized measure of blood clotting time. The
therapeutic INR target depends on the clinical situation: most indications
require an INR between 2.0 and 3.0, while mechanical heart valves generally
require a higher range, around 2.5 to 3.5. Prescribing Sintrom means adjusting
the daily dose to keep the patient within this target range. If the INR is below
target, the dose should be increased; if the INR is above, the dose should be
reduced or temporarily stopped, and in cases of very high INR, vitamin K may be
considered to reverse the effect. Regular monitoring is essential, especially
when starting treatment or after dose adjustments, typically every few days
initially and then every few weeks once the INR is stable. Prescribers must also
take into account interactions with diet, alcohol, and other medications.
Dataset
A 3.6MB excel file with sintrom and inr records of 9114 patients for a total of 123898 days.
Q-table visualization
>>> import pandas as pd
>>> from sara.oar import enrich_rtg, discount_from_horizon, bin_with_quantiles
>>> from sara.viz import plot_insight
>>> from pathlib import Path
>>> from examples.sintrom import env_pipeline
>>> filename = Path("examples/sintrom/sintrom_transformed.pkl")
>>> df = pd.read_pickle(filename)
>>> df = env_pipeline(df)
>>> df = enrich_rtg(  # compute return-to-go with one week horizon
...     df,
...     discount=discount_from_horizon(7))
>>> num_quantiles = {
...     ("act0", "sintrom"): 5,
...     ("obs0", "inr"): 20}
>>> df = bin_with_quantiles(df, num_quantiles)
>>> _,_,_=plot_insight(  # plot Q-table
...     df,
...     col_labels=list(num_quantiles),
...     filename="docs/source/sintrom/sintrom.png")
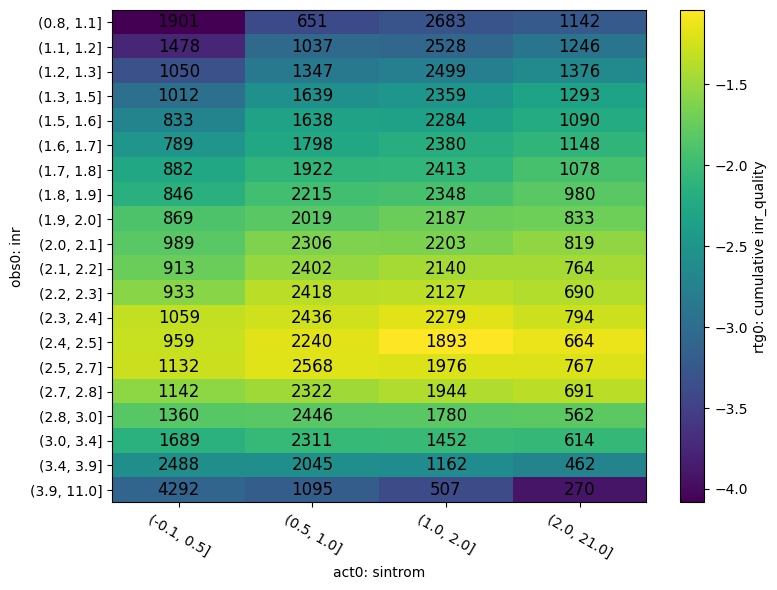
Interpretation
Q-table is coherent with recommendations: if INR is low, increase Sintrom dose, if INR is high, decrease dose.
API reference
- class examples.sintrom.SintromEnvSchema(*args, **kwargs)[source]
Pandera OAR Schema for sintrom prescription environment.
- examples.sintrom.env_pipeline(df: DataFrame[SintromETLSchema], lag: int = 1, inr_set_point: float = 2.5) DataFrame[SintromEnvSchema][source]
Transform Sintrom ETL dataframe into Env dataframe with environment definition.
- Parameters:
df – the dataframe from
etl_pipeline()lag – how many days before act and inr used in reward computation
inr_set_point – the target value for the inr, used in reward compuation
- Returns:
- env formatted dataframe,
see
SintromEnvSchemafor a description of this dataframe structure.
- Return type:
DataFrame[SintromEnvSchema]
Examples
Initialize pipeline
>>> import pandas as pd
>>> from examples.sintrom import env_pipeline
>>> df = pd.read_pickle("examples/sintrom/sintrom_transformed.pkl")
>>> df = env_pipeline(df)
Check dataframe
>>> df
signal            obs0    act0        rew1
key               inr sintrom inr_quality
row   date
1     2016-01-07  2.01     2.0       -0.49
      2016-01-08  2.01     3.0       -0.49
      2016-01-09  2.01     3.0       -0.49
      2016-01-10  2.01     3.0       -0.49
      2016-01-11  2.01     3.0       -0.49
...                ...     ...         ...
11682 2019-12-30  2.19     1.0        -0.5
      2019-12-31   2.0     3.0        -0.5
11683 2019-12-31  2.43     1.0       -0.07
11685 2019-12-31   2.3     1.0        -0.2
11689 2019-12-31  2.48     1.0       -0.02

[123898 rows x 3 columns]