Generating Qtable visualizations
Let us load previous Enriched dataframe:
>>> import pandas as pd
>>> df = pd.read_pickle("docs/source/golf_enriched.pkl")
A central tool in reinforcement learning is the Q-table. It takes an observation and an action as input and delivers the average rtg encountered in this situation. This is very convenient since it allows to act in an environment in an optimal way:
Get the current observation from the environmnent.
Put it into the Q-table and test different actions.
Select the action that gave maximal rtg.
‘SARA’ provides visualization of those Q-tables. In order to use them, we should ensure observations and actions are discretized. SARA provide a helper function to bin OAR dataframe based on quantiles:
>>> from sara.oar import bin_with_quantiles
>>> df = bin_with_quantiles(df, num_quantiles={
...     ("act0", "move"): 3,
...     ("obs0", "position"): 10})
Now we are ready to plot our Q-table:
>>> from sara.viz import plot_insight
>>> _,_,_ = plot_insight(df, col_labels=[("act0", "move"), ("obs0", "position")],
...     filename="docs/source/golf_qtable.png")
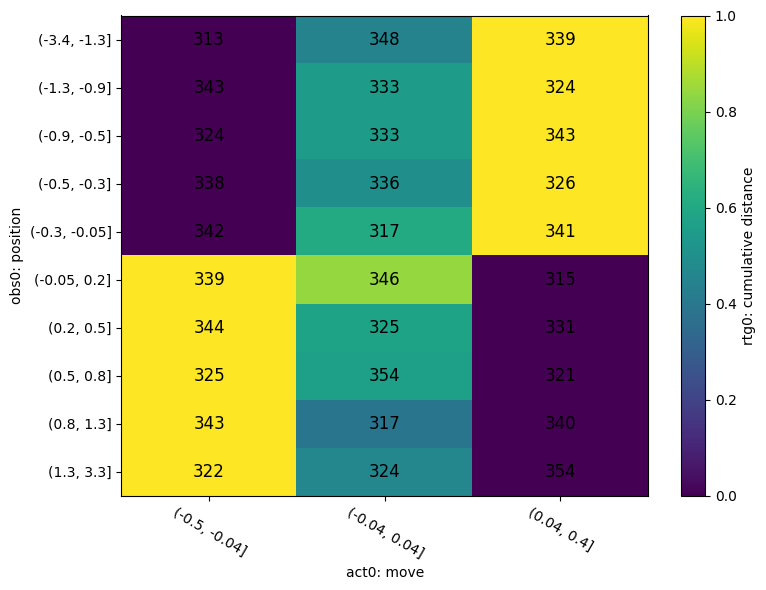
In the x-axis, you can see the different quantiles for the move. In the y-axis you can see the different quantiles for the position. The color in each cell is the average return to go encountered in the observation-action configuration. Finally, the number in the cell is a confidence index which is simply the number of time the configuration has been encountered in the dataframe.
The Q-table validates the intuition: when the position is negative, we have to make a positive move and conversely in order to reach the whole. Indeed, for positions below 0, the return to go increases when the move increases. Conversely, for positions above 0, the return to go decreases when the move increases.
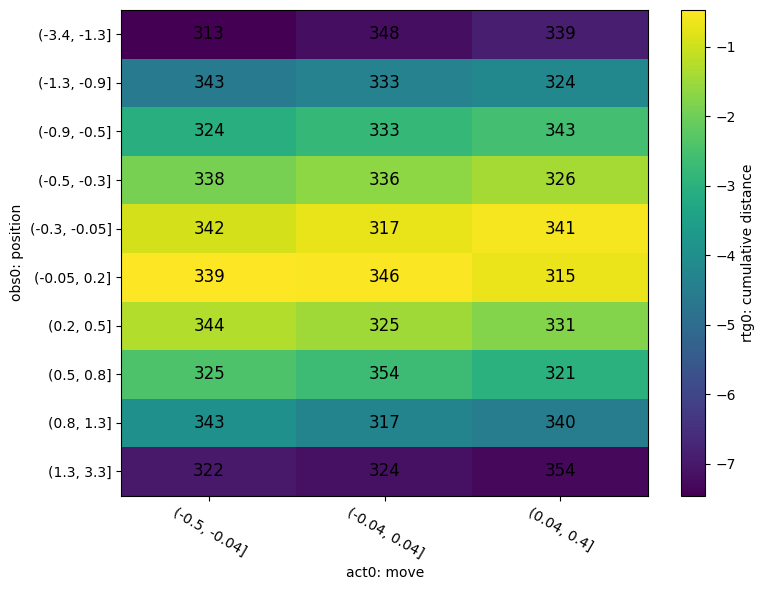
In order to see this more clearly, we can use the following functionality that normalizes the rtg over the x-axis: it is then even easier to compare actions.
>>> _, _, _ = plot_insight(df, col_labels=[("act0", "move"), ("obs0", "position")],
...     normalize_on_x=True,
...     filename="docs/source/golf_qtable_n.png")