Golf
Golf sara.viz example.
>>> import textwrap
>>> from examples.golf import GolfSchema
>>> print(textwrap.fill(GolfSchema.Config.metadata["description"], width=80))
A simple golf environment. The objective is to shot a ball in a hole
Dataset
1000 episodes of 10 steps randomly generated
Q-table visualization
>>> from sara.oar import enrich_rtg, discount_from_horizon, bin_with_quantiles
>>> from sara.viz import plot_insight
>>> from examples.golf import env_pipeline
>>> df = env_pipeline()
>>> df = enrich_rtg(df, discount=.9)
>>> num_quantiles={
...     ("act0", "move"): 3,
...     ("obs0", "position"): 10,
... }
>>> df = bin_with_quantiles(df, num_quantiles)
>>> _,_,_ = plot_insight(df, col_labels=list(num_quantiles),
...              filename="docs/source/golf/golf.png")
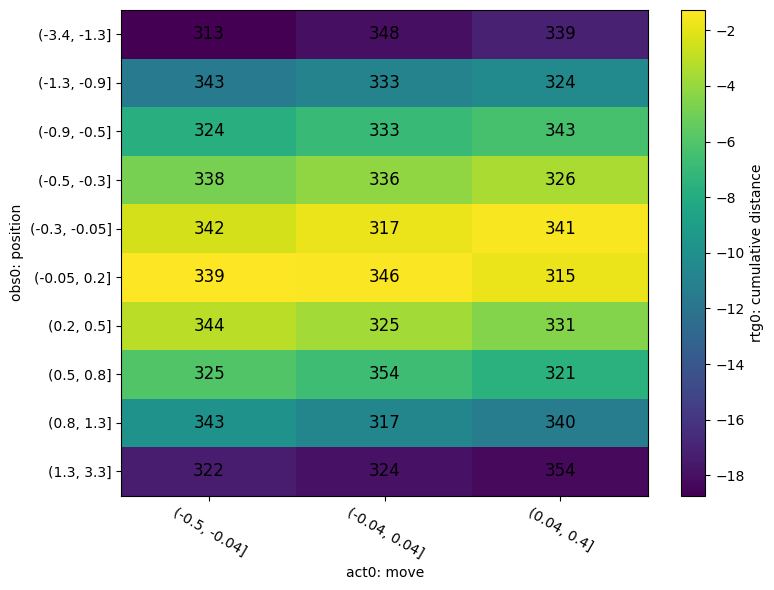
Interpretation
When the ball is at the hole left, we should move right. Conversely, when the ball is at the hole right we should move left
API reference
- examples.golf.env_pipeline(num_episodes: int = 1000, len_episode: int = 10, seed: int = 42) DataFrame[GolfSchema][source]
Generates OAR dataframe for golf environment.
- Parameters:
num_episodes – number of episodes in the dataset
len_episode – number of steps in each episodes before truncation
seed – for random number generator
- Returns:
OAR dataframe with sampled data
- Return type:
DataFrame[GolfSchema]
Examples
>>> from examples.golf import env_pipeline
>>> env_pipeline()
signal                            obs0      act0      rew1
key                           position      move  distance
episodes date
0        2000-01-01 10:00:00  0.176277  0.030472 -0.176277
         2000-01-01 10:01:00  0.206749 -0.103998 -0.206749
         2000-01-01 10:02:00  0.102750  0.075045 -0.102750
         2000-01-01 10:03:00  0.177795  0.094056 -0.177795
         2000-01-01 10:04:00  0.271852 -0.195104 -0.271852
...                                ...       ...       ...
999      2000-01-01 10:05:00  0.486030  0.162011 -0.486030
         2000-01-01 10:06:00  0.648040 -0.006318 -0.648040
         2000-01-01 10:07:00  0.641722  0.008525 -0.641722
         2000-01-01 10:08:00  0.650247  0.112474 -0.650247
         2000-01-01 10:09:00  0.762722 -0.018285 -0.762722

[10000 rows x 3 columns]